You might have already noticed a new tab on the PSQuery Manager - Transformations.
This is the place where you can place your custom XSL code and render the query in a much better way, than displaying it in a traditional way.
The best part I loved about this is that, you can create excellent report from the query, without using any existing reporting tools, but with just few lines of XSL + HML fused together. That's awesome!
 |
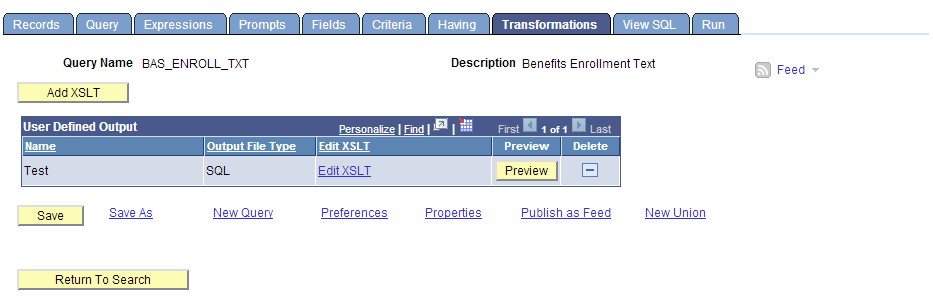
| To add a new XSL, click on the Add XSLT button. |
 |
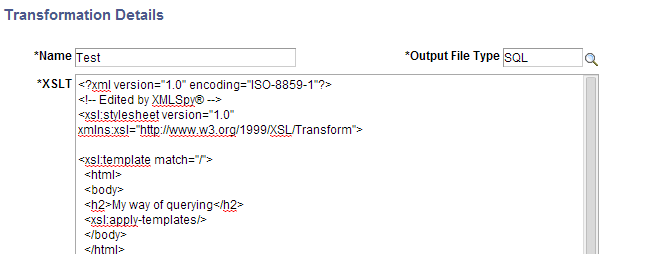
| It opens the data entry window for you to place the XSL. |
 |
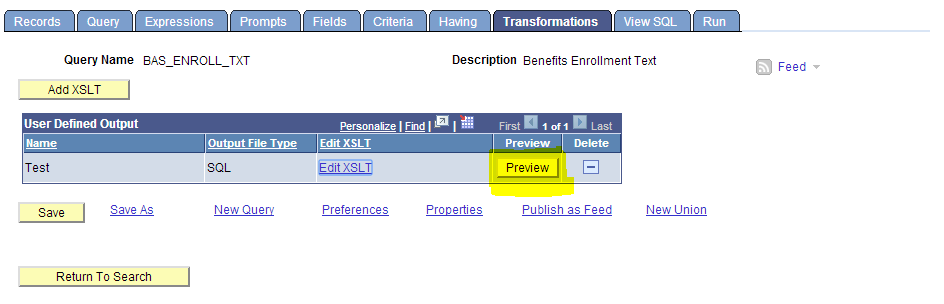
| To view the XSL effect on the query, click on the Preview button. |
 |
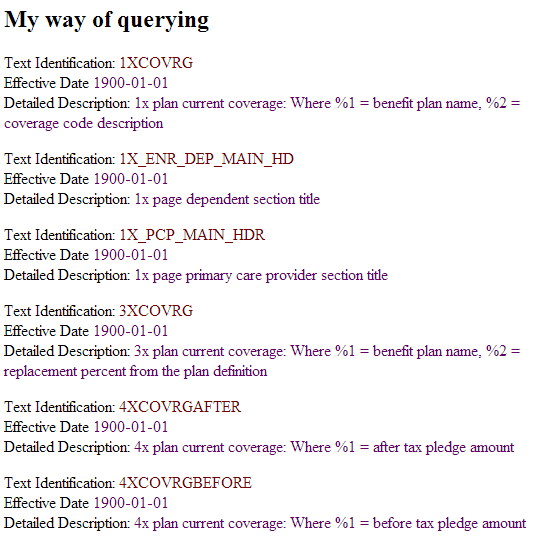
| The XSL which I placed, transforms the query into a tabular structure and easy to go through. |
 |
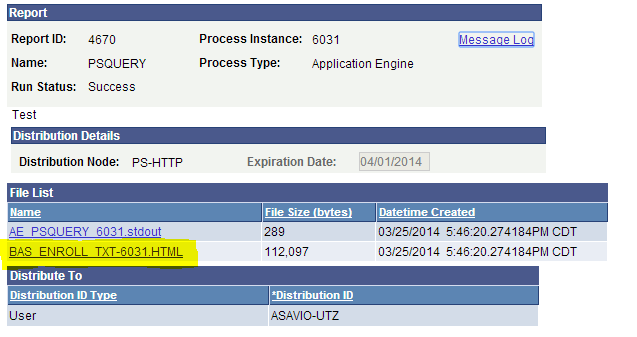
| If you want to generate the transformed report, then schedule the query and you have it! |

No comments:
Post a Comment